
A project portfolio dashboard is a centralised, visual tool that monitors multiple initiatives' health, performance, and strategic alignment in real time. For assurance, risk, and compliance leaders, it replaces the exhausting cycle of chasing individual project updates with a single, structured view of what matters most.
Core components you should expect to see:
- Portfolio health status — RAG-coded summaries across all active initiatives
- Budget variance — planned versus actual spend at portfolio level
- Resource utilisation — capacity allocation and availability across teams
- Timeline progress — milestone tracking and schedule slippage indicators
- Strategic initiative tracking — alignment of delivery against organisational objectives
Table of Contents
- How does a project portfolio dashboard differ from a project dashboard?
- Why portfolio dashboards strengthen governance and assurance
- Best practices for reliable dashboard implementation
- How AI moves portfolio dashboards from reporting to assurance
- Which KPIs belong in a governance-focused portfolio dashboard?
- Integrating portfolio dashboards with your GRC systems
- Common pitfalls when deploying AI-powered portfolio dashboards
- Real-world impact: portfolio dashboards in continuous assurance
- Intelligentassessments: portfolio assurance built for regulated UK organisations
- Key takeaways
How does a project portfolio dashboard differ from a project dashboard?
The distinction matters more than most teams realise. A project dashboard serves the delivery team: tasks, milestones, sprint progress. A portfolio dashboard serves executive and PMO leaders, consolidating trends across every initiative rather than drilling into any single one.
Key differences at a glance:
- Focus: tactical execution versus strategic alignment and portfolio health
- Audience: project teams versus governance and executive leadership
- Timescale: short-term task management versus long-term portfolio trends
- Data volume: granular project data versus consolidated cross-department metrics
PMO dashboards sit firmly in the second category. They inform decisions about resource distribution, portfolio prioritisation, and organisational strategy — not whether a specific task is overdue.
Why portfolio dashboards strengthen governance and assurance
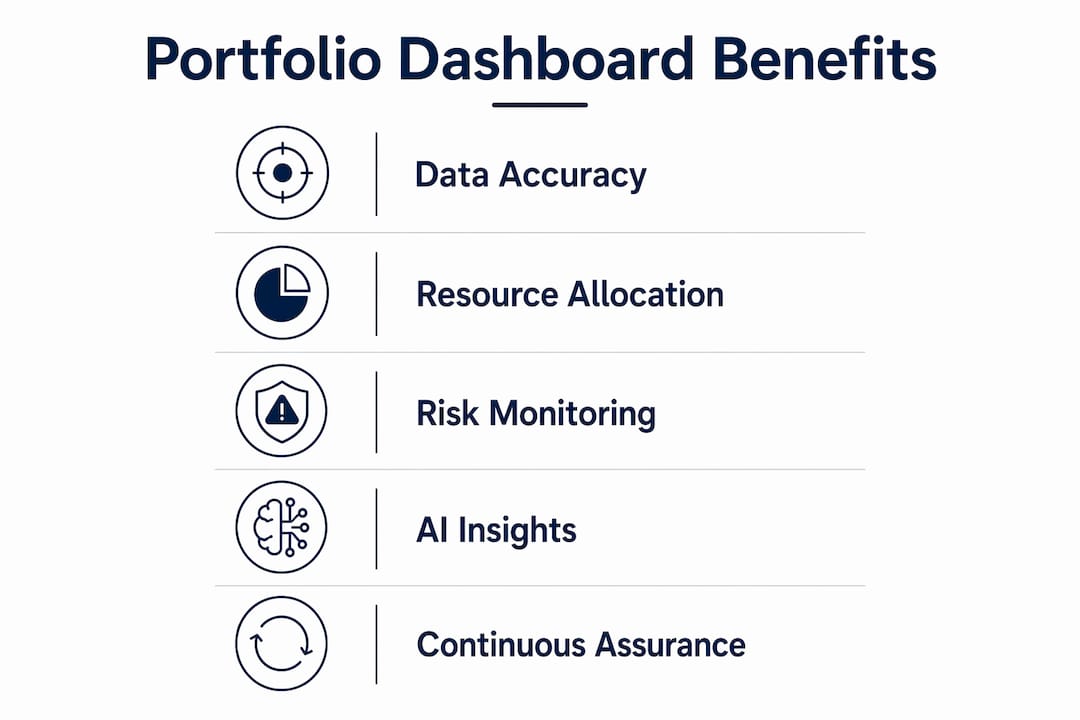
Consistent, real-time visibility is what separates reactive governance from proactive assurance. When risks surface in a dashboard before they escalate, leaders can intervene early rather than manage consequences.
Benefits for regulated organisations include:
- Faster identification of delivery risks and budget overruns across the portfolio
- Unified data views that improve communication between PMOs and executive leadership
- Clearer compliance tracking against organisational objectives and regulatory requirements
- Reduced reliance on manual status reports, which are slow and prone to inconsistency
Best practices for reliable dashboard implementation
Data quality determines whether a dashboard builds trust or destroys it. Fragmented source data across finance, operations, and delivery functions is the single most common reason dashboards fail to gain leadership confidence.
- Standardise data sources — agree common definitions and formats across departments before building any visualisation layer.
- Automate data ingestion — manual data entry introduces delays and errors; automated imports keep dashboards current.
- Prioritise KPIs linked to objectives — metric overload dilutes focus; fewer, better-chosen indicators outperform comprehensive but unread reports.
- Build iteratively — align dashboard features with evolving governance needs and gather stakeholder feedback at each stage.
- Plan for adoption — complexity is the enemy of uptake; design for the executive audience first, with drill-down for analysts.
How AI moves portfolio dashboards from reporting to assurance
Static dashboards tell you what happened. AI-powered dashboards tell you what is about to happen. That shift from retrospective reporting to proactive risk monitoring is where continuous assurance becomes genuinely possible.
AI-driven capabilities that change the picture:
- Weighted RAG scoring — automated health calculations that remove subjective self-reporting
- Predictive analytics — early signals of resource capacity gaps and budget trajectory issues
- Automated executive summaries — AI-generated narrative insights that save hours of manual preparation
- Continuous evidence collection — audit trails updated in real time rather than assembled retrospectively
Intelligentassessments delivers all of these within its continuous assurance platform, purpose-built for regulated UK organisations.
Pro Tip: Set your AI dashboard to flag any project where two or more RAG indicators shift to amber simultaneously — that combination predicts escalation more reliably than any single metric alone.
Which KPIs belong in a governance-focused portfolio dashboard?
Executive stakeholders consistently prefer high-level RAG summaries with drill-down access rather than dense metric tables. The goal is decision-readiness, not data completeness.
KPIs worth tracking:
- Portfolio health (RAG status) — overall and by strategic theme
- Budget variance — forecast versus actual at portfolio and programme level
- Resource utilisation and capacity availability — demand versus supply across teams
- Forecast accuracy — how reliably project estimates translate to outcomes
- Strategic initiative progress — progress of OKRs towards their targets
- Portfolio risk exposure — open risks by severity and owner
Review and adjust these periodically. KPIs that made sense at programme inception often lose relevance as strategic priorities shift.
Integrating portfolio dashboards with your GRC systems

A portfolio dashboard that sits outside your governance, risk, and compliance ecosystem creates a new silo rather than eliminating existing ones. Integration is what turns a reporting tool into a continuous assurance capability.
Integration priorities:
- API connectivity — automated data flows between portfolio tools and GRC platforms
- Audit trail automation — evidence captured and timestamped without manual intervention
- Compliance workflow triggers — dashboard thresholds that initiate review or escalation processes
- Unified reporting — single outputs that satisfy both operational and regulatory audiences
Intelligentassessments integrates these capabilities natively, replacing the spreadsheet-and-email governance model that still persists across many UK utilities and infrastructure organisations.
Common pitfalls when deploying AI-powered portfolio dashboards
Most dashboard projects that underdeliver do so for predictable reasons. Knowing them in advance is half the solution.
- Poor data quality — untrusted inputs produce outputs nobody acts on; fix the data before building the dashboard.
- Metric overload — too many KPIs overwhelm executives and obscure the signals that matter.
- User resistance — teams that distrust the underlying data will revert to spreadsheets; involve stakeholders early.
- Security gaps — risk and compliance data requires role-based access controls and audit logging; never treat this as an afterthought.
- Big-bang deployment — launching a fully-featured dashboard on day one maximises the chance of failure; iterate in phases.
Real-world impact: portfolio dashboards in continuous assurance
Regulated organisations that have moved to AI-powered portfolio reporting consistently report the same outcomes: risks surface earlier, resource decisions improve, and governance reporting takes less time.
Specific impacts observed in practice:
- Earlier identification of delivery bottlenecks before they affect programme milestones
- Improved resource allocation decisions driven by capacity visibility rather than intuition
- Time savings on executive reporting cycles, freeing assurance teams for higher-value work
- More confident strategic decisions by senior leaders who trust the data they are seeing
Intelligentassessments client outcomes reflect this pattern: organisations in regulated UK sectors replacing manual assurance processes with structured, AI-driven portfolio visibility.
Intelligentassessments: portfolio assurance built for regulated UK organisations
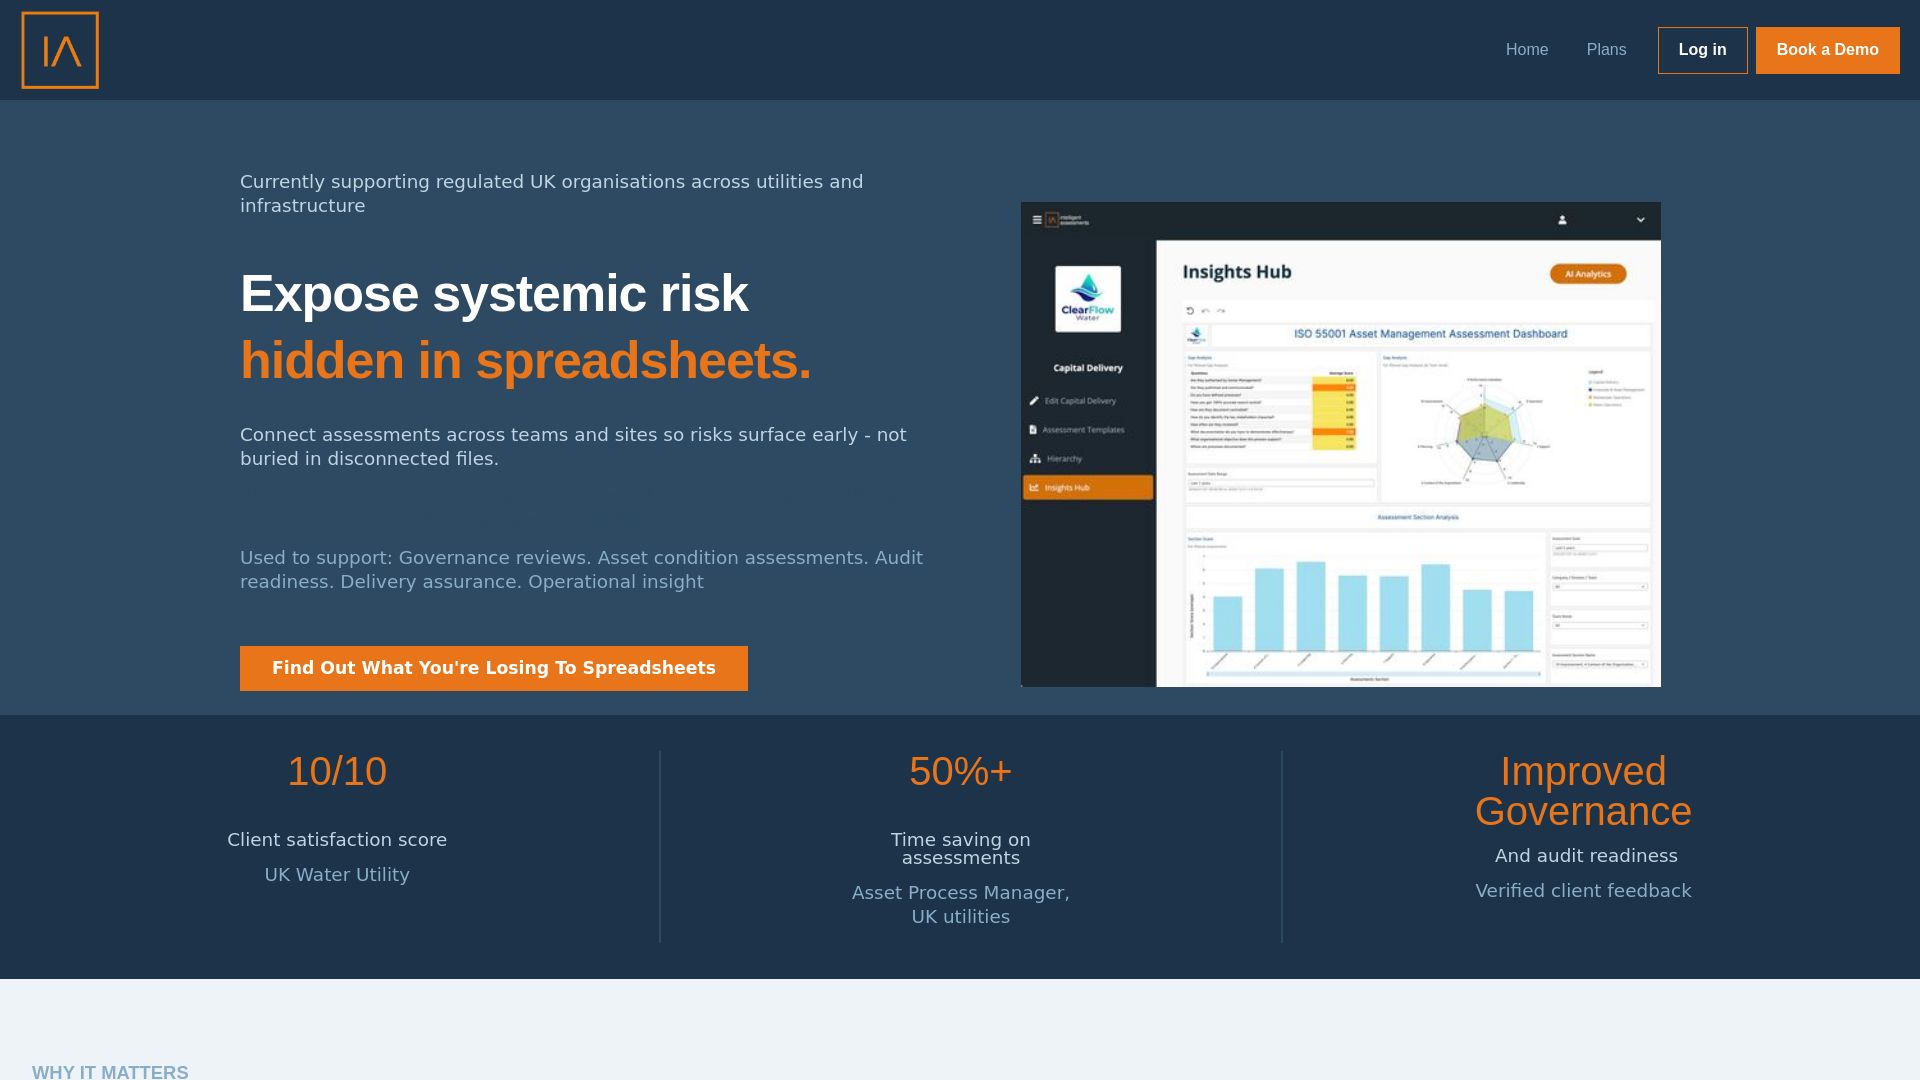
Regulated organisations running complex portfolios need more than a reporting tool. Intelligentassessments replaces fragmented spreadsheets and disconnected audit trails with a single AI-powered platform that delivers weighted RAG scoring, automated executive summaries, real-time dashboards, and structured evidence management — all within a secure, subscription-based SaaS model designed for UK utilities and infrastructure.
Where generic project tools require significant configuration to serve governance needs, Intelligentassessments arrives with template libraries, compliance frameworks, and continuous assurance workflows already built in. The result is portfolio visibility that your board can trust from day one.
Book a demo to see how the platform works in a regulated UK context, or review subscription plans to find the right fit for your organisation.
Key takeaways
A project portfolio dashboard delivers genuine assurance value only when it combines clean data, AI-driven insights, and integration with existing governance and compliance systems.
| Point | Details |
|---|---|
| Portfolio vs project dashboards | Portfolio dashboards serve executive governance; project dashboards serve delivery teams — they are complementary, not interchangeable. |
| Data quality is foundational | Standardising source data across departments before building dashboards is the single most important implementation step. |
| AI enables proactive assurance | Weighted RAG scoring, predictive analytics, and automated summaries shift dashboards from retrospective reporting to early risk detection. |
| KPI discipline matters | Linking metrics directly to organisational objectives prevents overload and keeps dashboards decision-ready for leadership. |
| Intelligentassessments | Provides AI-powered portfolio dashboards with built-in compliance frameworks, evidence management, and real-time RAG scoring for regulated UK organisations. |