
Assurance mapping is the process of structuring a matrix that identifies every significant element requiring assurance, matches it to the providers and activities across the four lines of defence, and scores the quality and coverage of what exists. According to ICAEW's foundational guidance, it should be treated as a live document, reassessed at least annually, and used to help boards and audit committees take appropriate comfort from the assurance they receive. To start within days, take three steps:
- Identify a sponsor (typically the chief audit executive, chief risk officer, or audit committee chair) with the authority to convene the right people.
- Agree the scope: which elements, risks, or objectives the first map will cover and which lines of defence are in scope.
- Book a first workshop with representatives from internal audit, risk management, compliance, and at least one second-line function to populate the initial matrix.
The two main practical authorities in the UK are ICAEW and The IIA. Both publish templates and worked examples that make a first map achievable in weeks, not months.
Key takeaways
An assurance map is the most direct mechanism a UK organisation has for evidencing that its board is receiving coordinated, quality-assured coverage of every material risk.
| Point | Details |
|---|---|
| Start with a sponsor and scope | Identify a senior sponsor and agree the scope before the first workshop; without both, the map stalls. |
| Follow the ICAEW 10-step process | The structured workflow from sponsor identification to agreed actions produces a board-ready map in weeks. |
| Score quality, not just coverage | Rate each assurance activity against independence, scope, methodology, evidence, and timeliness; aggregate scores reveal false comfort. |
| Maintain as a live document | Reassess at least annually, with event-driven updates, tied to existing board and audit committee cycles. |
| Intelligentassessments digitises the process | The platform automates weighted RAG scoring, evidence management, and dashboards for teams ready to move beyond spreadsheets. |
Table of Contents
- What an assurance map actually looks like
- Why assurance mapping matters for governance
- What every assurance map must include
- How to create an assurance map: a 10-step workflow
- Using the map to coordinate assurance and document reliance
- Templates and tooling: from spreadsheets to digital platforms
- Keeping the map live: maintenance and governance cadence
- Common pitfalls and a quality-check template
- Presenting assurance-map outputs to the board and audit committee
- Legal and regulatory considerations for assurance mapping in the UK
- What practice actually teaches you about embedding assurance maps
- Intelligentassessments supports your assurance-mapping programme
- Sources
What an assurance map actually looks like
An assurance map is a structured matrix. Each row represents an element requiring assurance: a risk, a control objective, a regulatory obligation, or a strategic priority. The columns capture everything the organisation needs to know about the assurance it has, or does not have, against that element.
Common fields practitioners use include:
- Element requiring assurance (the risk, objective, or obligation)
- Desired assurance level (what the board or audit committee needs to be comfortable)
- Line of defence (first, second, third, or fourth/external)
- Assurance provider (the team, committee, or external body responsible)
- Assurance activity (the specific review, audit, certification, or monitoring process)
- Frequency (how often the activity runs: continuous, quarterly, annual)
- Sample evidence (the report, certificate, or dashboard that demonstrates the activity occurred)
- Assurance quality rating (a scored or RAG assessment of independence, scope, methodology, and timeliness)
- Aggregate assurance (the combined picture across all providers for that element)
- Outcome and actions (gaps, overlaps, and what needs to change)
A worked example makes this concrete. Take cyber incident response as the element. The first line of defence is the IT operations team running regular vulnerability scans and tabletop exercises. The second line is the information security function conducting periodic policy reviews and continuous monitoring via a SIEM platform. The third line is internal audit, which completed a cyber resilience review more than a year ago. The fourth line is an external penetration test carried out regularly by a specialist firm. Populating the matrix immediately reveals a gap: internal audit's last review is outside the twelve-month window, and the tabletop exercises have no documented output that constitutes formal assurance evidence. The map does not just describe what exists, it shows where the coverage is thin.
Why assurance mapping matters for governance
A well-constructed assurance map improves the quality of decisions at board and audit committee level by turning a fragmented set of assurance outputs into a single, coordinated picture. Without it, boards routinely receive overlapping reports from multiple functions without any mechanism to judge whether the combined coverage is adequate or whether critical areas are missed entirely.
The concrete governance benefits include:
- Boards and audit committees gain a clear, evidenced basis for their statements on risk and internal control, replacing reliance on informal judgement with a documented assurance position.
- Management can see where assurance is duplicated and redirect resource to under-covered areas, reducing cost without reducing confidence.
- Internal audit can plan its programme around genuine gaps rather than repeating work already done by second-line functions, improving the relevance and impact of its findings.
- Assurance providers across all lines understand their role in the wider picture, which reduces the risk of contradictory conclusions reaching the board simultaneously.
- Regulators and external auditors benefit from a clear audit trail showing how the organisation has assessed its own assurance coverage, which can support reliance decisions and reduce duplication of effort.
The coordination function of the map is directly tied to IIA requirements. IIA Global Internal Audit Standards require internal audit to coordinate with other assurance providers, minimise duplication, highlight coverage gaps, and document reliance decisions with clear accountability for conclusions. An assurance map is the practical mechanism for meeting those obligations.
The map turns governance from a narrative into evidence. Boards that rely on verbal assurances from management are in a fundamentally different position from those that can point to a scored, maintained matrix showing coverage, quality, and gaps across every material risk.
What every assurance map must include
The core components are non-negotiable if the map is to support genuine governance decisions rather than create false comfort. ICAEW's 10-step guidance treats the map as a scored matrix: quality attributes are assessed for each assurance activity and then aggregated to a per-element score.
The four lines of defence in UK practice typically map as follows:
- First line: operational management and control owners (business units, process owners, project managers)
- Second line: risk management, compliance, legal, information security, and health and safety functions
- Third line: internal audit
- Fourth line: external audit, regulators, and independent third-party assessors
Each assurance activity should be assessed against five quality attributes: independence of the provider from the activity being assured, scope alignment with the element's risk profile, methodology rigour (documented and repeatable), evidence trail (a report or output that can be reviewed), and timeliness (the activity is recent enough to be relied upon).
The aggregate assurance score for each element combines the quality ratings across all active providers. A RAG approach works well: green where multiple high-quality providers give consistent coverage, amber where coverage exists but quality or frequency is borderline, red where there is a material gap or the only coverage comes from a first-line self-assessment with no independent verification.
Pro Tip: When scoring quality, resist the temptation to average scores mechanically. An element with three amber activities is not the same as one with one green and two reds. Look at the pattern: if the only high-quality activity is infrequent, the aggregate should reflect the timing risk, not just the quality of the activity when it runs.
The ICAEW assurance process guidance describes assurance engagements in lifecycle stages (planning, fieldwork, reporting) that are directly useful for understanding where evidence originates and how to capture it in the map's evidence column.
How to create an assurance map: a 10-step workflow
Follow a clear 10-step process aligned to ICAEW's methodology to produce a map that is board-ready and supports documented reliance.
- Identify a sponsor. The sponsor should have sufficient seniority to convene all four lines and to present findings to the audit committee. In most UK organisations this is the chief audit executive or the audit committee chair.
- Define the scope. Agree which elements will be mapped: the full risk register, a subset of material risks, regulatory obligations, or strategic objectives. Document the rationale for any exclusions.
- Assess desired assurance. For each element, agree the level of assurance the board or audit committee needs. This is a governance decision, not a technical one, and requires sponsor involvement.
- Identify assurance providers. Interview first, second, third, and fourth-line functions. Review terms of reference, audit plans, compliance monitoring frameworks, and external engagement letters to build a complete provider list.
- Identify assurance activities. For each provider, document the specific activities that generate assurance against each element. Review recent reports, dashboards, and certifications as evidence.
- Assess assurance quality. Score each activity against the five quality attributes (independence, scope, methodology, evidence trail, timeliness). Use a consistent scoring scale across all activities.
- Aggregate actual assurance. Combine quality scores across providers for each element to produce an aggregate assurance position. Apply RAG ratings.
- Analyse gaps and overlaps. Compare desired assurance against actual assurance. Identify elements that are under-assured (red or amber with no remediation plan) and those where multiple providers are covering the same ground without coordination.
- Agree actions. For each gap or overlap, agree a specific action: commission a new assurance activity, adjust an existing scope, establish a reliance arrangement, or accept the gap with documented rationale. Assign owners and deadlines.
- Determine a course of action and present to the sponsor. Produce the map in its final form, obtain sponsor sign-off, and schedule the first audit committee presentation.
Example row walkthrough: cyber incident response
| Column | Content |
|---|---|
| Element | Cyber incident response capability |
| Desired assurance | High: board requires independent evidence of response readiness |
| Line 1 provider | IT operations team |
| Line 1 activity | Quarterly tabletop exercises (no formal output) |
| Line 2 provider | Information security function |
| Line 2 activity | Annual policy review; continuous SIEM monitoring |
| Line 3 provider | Internal audit |
| Line 3 activity | Cyber resilience review (last completed 20 months ago) |
| Line 4 provider | External penetration testing firm |
| Line 4 activity | Annual penetration test (current) |
| Quality score | Line 1: amber (no evidence trail). Line 2: green. Line 3: red (out of date). Line 4: green |
| Aggregate | Amber |
| Actions | Internal audit to schedule cyber follow-up within six months; Line 1 to formalise tabletop outputs |
First workshop checklist:
- Invite: sponsor, head of internal audit, chief risk officer, compliance lead, information security lead, one operational business unit lead, external audit relationship manager
- Materials to bring: current risk register, last internal audit plan, compliance monitoring schedule, external audit plan, any existing assurance-related reports from the past 12 months
- Decisions to make: scope boundary, desired assurance levels for the top ten elements, scoring scale for quality attributes, owner for the next draft
- Owner for next steps: assign one person (typically the head of internal audit) to consolidate outputs and circulate a draft matrix within two weeks
Using the map to coordinate assurance and document reliance
An assurance map is the operational foundation for documented reliance and coordinated assurance. Without it, reliance decisions are informal, undocumented, and difficult to defend if challenged by a regulator or external auditor.
IIA standards require internal audit to record reliance decisions and accountability for conclusions. The assurance map provides the evidence base for those records. When internal audit decides to rely on a second-line compliance review rather than conduct its own fieldwork, the map should show:
- The specific element and activity being relied upon
- The quality assessment of that activity (independence, scope, methodology, evidence, timeliness)
- The threshold tests applied (did the activity meet the minimum quality standard for reliance?)
- The sign-off authority (who approved the reliance decision and when)
- The residual risk (what internal audit would do if the relied-upon activity subsequently proved inadequate)
A reliance memo, drafted alongside the map, captures this formally. It should be brief: one page per reliance arrangement, signed by the chief audit executive, and retained as part of the audit file.
The IIA Coordination and Reliance Assurance Mapping workbook provides a practical template for chief audit executives to adapt risk categories, providers, and coverage to their organisation. It is designed to be used alongside the IIA's Global Practice Guide on coordination and reliance, and it includes both an example map and a blank customisable version.
For IT and technology risks specifically, combined assurance approaches are particularly relevant. ISACA and IIA commentary underlines the need to coordinate IT audit, information security reviews, and third-party assessments, since these functions often cover overlapping ground with inconsistent methodologies. The assurance map makes those overlaps visible and creates a basis for agreeing which provider's output takes precedence.
Templates and tooling: from spreadsheets to digital platforms
The fastest starting point for most UK teams is one of two free resources. ICAEW's assurance mapping guidance includes a template and worked examples. The IIA workbook provides a downloadable, customisable matrix. Both are designed to be adapted rather than used verbatim.
For smaller or simpler organisations, ICAEW's dedicated helpsheet recommends a reduced-format map with fewer columns and a shorter production time. Smaller entities can collapse the four lines into two or three, focus primarily on management assurances, and use an 'overall assurance' column rather than separate quality scores for each activity. The core steps and sponsor oversight remain unchanged; only the format is simplified.
Spreadsheet workbooks versus digitised platforms
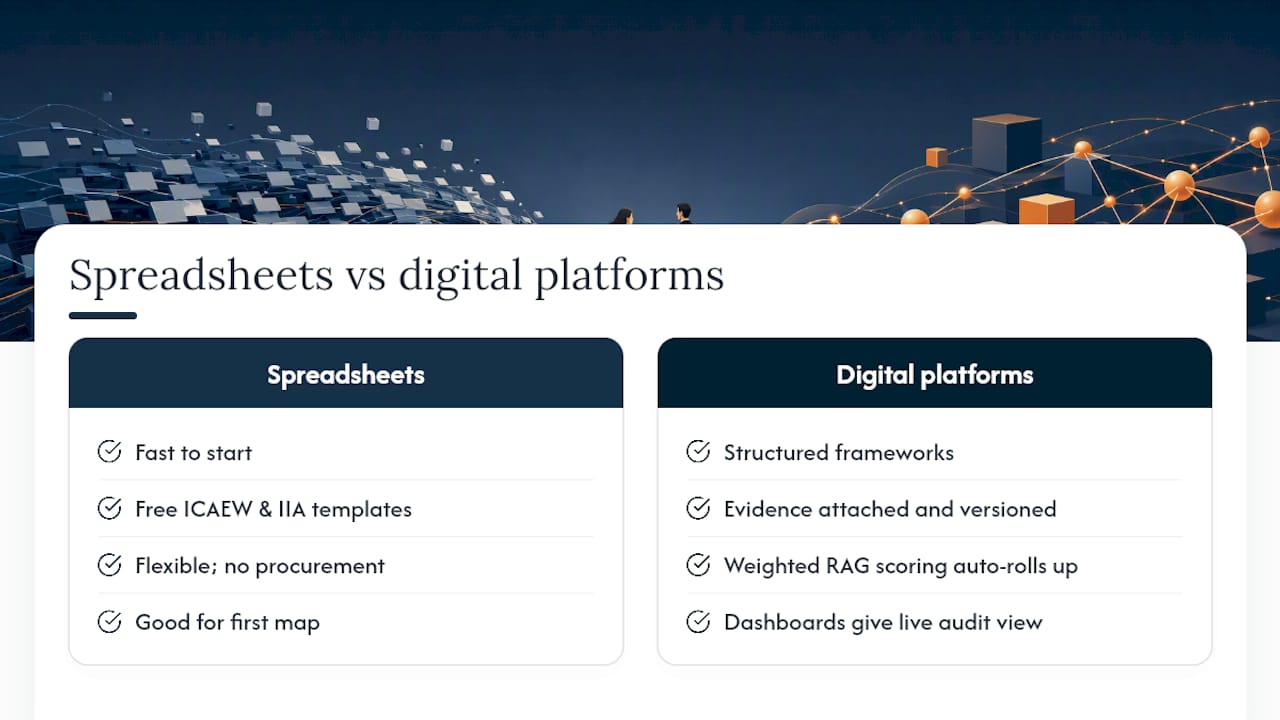
Spreadsheets are the right starting point for most teams building their first map. They are flexible, require no procurement, and the ICAEW and IIA templates drop straight into Excel or Google Sheets. The limitations become apparent quickly: version control is manual, evidence attachments are unwieldy, roll-up scoring requires formula maintenance, and collaboration across functions creates conflicting copies.
A digitised assurance platform addresses those limitations directly. Structured frameworks replace free-form cells, evidence is attached and version-controlled at the activity level, weighted RAG scoring rolls up automatically, and dashboards give the audit committee a live view rather than a static snapshot. The trade-off is procurement time, configuration effort, and the need to train users on a new system.
The indicators that a team has outgrown a spreadsheet are consistent: the map covers more than 30 elements, more than three functions are contributing data, the audit committee is asking for more frequent updates than an annual refresh, or version conflicts are causing governance errors. At that point, the single source of truth that a digital platform provides is worth the transition cost.
For teams already using a weighted scoring model for assurance quality, a digital platform that automates those calculations removes a significant source of inconsistency.
Keeping the map live: maintenance and governance cadence
Treat the assurance map as a live document with a mandated refresh cycle and clear change-trigger rules. A map that is produced once and filed is not an assurance map; it is a historical record with no governance value.
The minimum cadence recommended by ICAEW is an annual full reassessment, with sponsor approval of the updated map before it is presented to the audit committee. In practice, most UK organisations with active risk registers will also need event-driven updates when:
- A new material risk or regulatory obligation is identified
- An assurance provider changes scope, methodology, or personnel significantly
- An assurance activity is delayed, cancelled, or produces a qualified output
- The organisation undergoes a significant structural change (merger, disposal, major transformation programme)
Version control does not need to be complex. A simple naming convention (map version, date, approver) and a change log tab in the spreadsheet, or equivalent in a digital platform, is sufficient for most organisations. What matters is that the audit committee can see what changed between versions and why.
Embedding the refresh into existing governance cycles is the most reliable way to sustain the map. Tie the annual reassessment to the board's risk review, schedule the audit committee presentation immediately after, and include the map update as a standing item in the internal audit planning cycle. Organisations that treat the map as a separate project invariably let it lapse; those that attach it to a cycle that already has governance momentum keep it current.
Common pitfalls and a quality-check template
False comfort is the most dangerous outcome of a poorly maintained assurance map. A map that shows green across all elements when the underlying assurance is weak or stale is worse than no map at all, because it actively misleads the board.
Common pitfalls include:
- Over-aggregation: combining weak and strong assurance activities into a single green rating, masking the fact that the only high-quality activity runs once every three years
- Ignoring timing: treating an assurance activity as current when it was completed 18 or 24 months ago and the risk profile has changed since
- Informal activities counted as assurance: including management meetings, verbal updates, or self-assessments with no documented output as if they were formal assurance activities
- Inconsistent scoring: different people applying the quality scoring criteria differently across functions, making the aggregate meaningless
- Poor evidence trails: recording that an activity exists without attaching or referencing the report or output that demonstrates it occurred
- Lack of sponsor ownership: producing the map without active sponsor engagement, so no one has authority to challenge weak ratings or commission remediation
The IIA's Quality Assurance and Improvement Programme guidance reinforces the importance of annual quality assessments to confirm that assurance activities provide appropriate coverage of significant risks.
Quality-check template for each assurance activity:
Any activity that fails two or more checks should be rated red regardless of the aggregate picture. Corrective actions for failed checks include: commissioning a targeted assurance review to fill the gap, adjusting the reliance threshold so internal audit does not rely on the weak activity, rescheduling overdue activities, and assigning a named owner for remediation with a deadline.
Presenting assurance-map outputs to the board and audit committee
Lead with the headline assurance position, critical gaps and overlaps, and proposed actions. Boards do not need the full matrix in the board pack; they need a clear, evidenced narrative that tells them where the organisation stands and what is being done about the gaps.
A three-slide structure works well for most UK audit committees:
- Slide 1: Executive assurance heatmap and summary. A visual representation of aggregate assurance by element (RAG), the number of elements at each rating, and a one-paragraph narrative on the overall assurance position. This is the slide the chair will reference in the minutes.
- Slide 2: Key gaps, overlaps, and recommended actions. A table of the elements rated amber or red, the specific gap or overlap identified, the recommended action, the owner, and the deadline. No more than ten rows; if there are more, prioritise by risk materiality.
- Slide 3: Confidence and reliance summary, plus next steps. A brief statement of the reliance decisions made (which second-line activities internal audit is relying upon and why), the confidence level in the overall assurance position, and the planned next review date.
The board pack should include a short methodology annex, typically one paragraph, explaining how the map was constructed, how quality was scored, what the RAG criteria mean, and what the map does not cover. This sets appropriate expectations: the map reflects the assurance that exists, not an independent opinion on whether the underlying controls are effective. Boards that understand this distinction are better placed to ask the right questions.
For guidance on translating assurance-map outputs into committee-ready audit reports, the format principles are directly applicable.
Legal and regulatory considerations for assurance mapping in the UK
Assurance mapping sits at the intersection of several UK regulatory and governance frameworks, and the legal context shapes both what the map must cover and how it should be maintained.
The UK Corporate Governance Code (applicable to premium-listed companies) requires boards to carry out a robust assessment of the principal risks facing the company and to monitor the risk management and internal control systems. An assurance map is the most direct mechanism for evidencing that monitoring. The Financial Reporting Council's guidance on board effectiveness reinforces the expectation that audit committees will have a clear picture of the assurance they are receiving and from whom.
For regulated sectors, the obligations are more specific. Financial services firms regulated by the FCA and PRA operate under the Senior Managers and Certification Regime (SM&CR), which requires senior managers to take reasonable steps to prevent regulatory breaches in their areas of responsibility. An assurance map that documents coverage of the obligations within each senior manager's remit provides direct evidence of those reasonable steps. Water, energy, and other utility companies regulated by Ofwat, Ofgem, and equivalent bodies face similar expectations around documented governance and assurance over regulatory compliance.
The UK Bribery Act 2010 and the Modern Slavery Act 2015 both create specific compliance obligations that benefit from explicit mapping: organisations need to demonstrate that adequate procedures are in place and that those procedures are being monitored. An assurance map that includes these obligations as named elements, with documented provider activities and quality scores, provides a defensible record.
Data protection obligations under the UK GDPR and the Data Protection Act 2018 add a further dimension. Assurance over data processing activities, security controls, and breach response capability should appear as named elements in the map for any organisation handling significant volumes of personal data.
One practical point: the assurance map itself is a governance document and may be disclosable in litigation or regulatory investigation. Organisations should treat it with the same care as board minutes, ensure it is factually accurate, and avoid language that overstates the confidence the map supports. A map that records genuine gaps and the actions being taken to address them is a stronger legal position than one that papers over weaknesses.
What practice actually teaches you about embedding assurance maps
The organisations that embed assurance mapping successfully share one characteristic: they treat the first map as a starting point, not a finished product. The teams that struggle are usually those that spend six months designing the perfect template before populating a single row.
Start with a scope of ten to fifteen elements, get the first map to the audit committee within three months, and let the committee's questions shape the next iteration. The quick win of a first presentation, even with amber and red ratings visible, builds more momentum than a comprehensive map that arrives eighteen months late.
Two practical tips that experienced practitioners consistently find useful:
First, tie every map refresh explicitly to an existing committee cycle. If the audit committee meets quarterly, the map update goes on the agenda for the meeting that follows the annual risk review. It does not need a separate slot; it becomes part of the existing rhythm. Committees that see the map once a year as a standalone item treat it as a compliance exercise. Those that see it as a standing input to risk discussions treat it as a governance tool.
Second, publish a short annual assurance statement, supported by the map, that the board can reference in its annual report. It need not be long: two paragraphs stating the scope of the assurance programme, the overall assurance position, the material gaps identified, and the actions taken. This creates accountability, signals to regulators and external auditors that the organisation takes its assurance obligations seriously, and gives the audit committee a concrete output to point to.
The ICAEW guidance is clear that the map's value is lost without scheduled reassessment and sponsor-led embedding. That is not a procedural point; it is the difference between a governance tool and a filing exercise.
Intelligentassessments supports your assurance-mapping programme
Intelligentassessments is an AI-powered continuous assurance platform built for regulated UK organisations that need more than a spreadsheet to manage their assurance programme. The platform replaces manual matrix maintenance with structured assessment frameworks, evidence management at the activity level, automated weighted RAG scoring and roll-ups, and real-time dashboards that give audit committees a live view of the assurance position rather than a static annual snapshot.
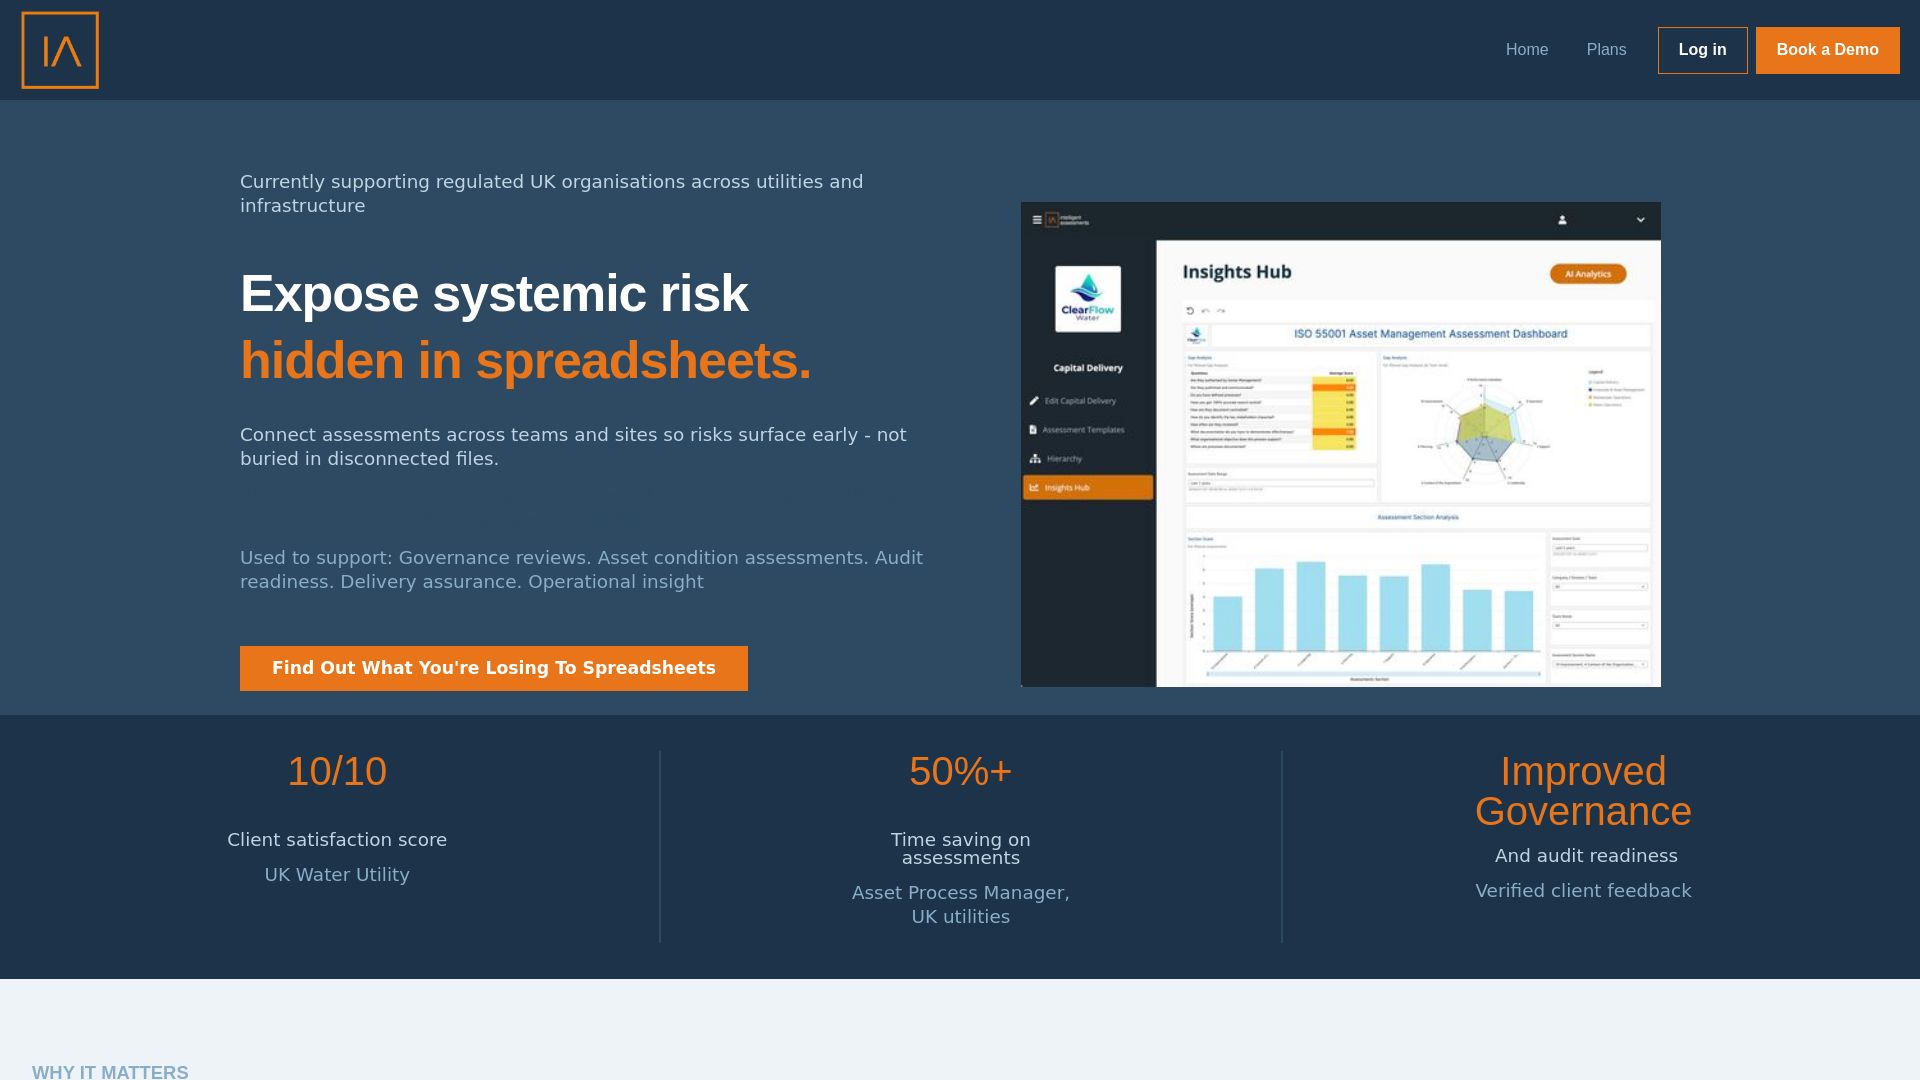
For teams ready to move beyond spreadsheet workbooks, Intelligentassessments provides a template library covering assurance mapping, compliance reviews, governance assessments, and delivery assurance, all within a single platform. Evidence is version-controlled, AI-generated executive summaries reduce reporting time, and CSV exports and PDF reports make audit committee packs straightforward to produce. The platform supports governance workflows and evidence trails; it does not replace the professional judgement of the assurance leaders using it.
Book a demo to see how the platform can support your assurance-mapping programme and reduce the administrative burden of maintaining a live map.
Sources
The sources below are the primary authorities for assurance mapping in the UK. Each is directly referenced in this guide.
- Assurance mapping: a vital tool | Assurance practical guidance | ICAEW
- Coordination and Reliance Assurance Mapping Tool | The IIA