
A risk and control self-assessment (RCSA) is a systematic process in which business units identify their operational risks, evaluate the design and operating effectiveness of their controls, and calculate residual risk using the formula: residual risk = inherent risk (likelihood × impact) adjusted for control effectiveness. The single most practical action you can take today is to run a pilot workshop with one business area, score three to five risks end-to-end, and use that output to calibrate your scoring scales before rolling out further.
Done well, the RCSA process delivers three things that matter to senior stakeholders: decision-quality risk data that reflects what is actually happening in operations, a prioritised remediation plan that directs resource to the highest residual risks, and board reporting that is auditable and evidence-backed rather than opinion-led.
- Decision-quality data: assessments grounded in evidence rather than gut feel
- Prioritised remediation: action plans ranked by residual risk score, not by who shouted loudest
- Auditable reporting: a documented trail from risk identification through to closure, ready for internal audit or regulator review
Table of Contents
- What the RCSA process actually measures and why UK regulators care
- The six core steps of the RCSA lifecycle
- How to run an RCSA workshop that produces usable outputs
- How to score risks and controls: matrices, residual risk and KRIs
- Turning RCSA findings into governance outputs
- How often to run RCSAs and what to budget
- Common RCSA pitfalls and how to avoid them
- Moving from annual attestation to continuous, data-led RCSA
- A copyable RCSA template for your risk register and workshop checklist
- Key takeaways
- Why most RCSA programmes underdeliver and what actually fixes them
- How Intelligentassessments supports a continuous RCSA programme
- Useful sources and further reading
What the RCSA process actually measures and why UK regulators care
A risk and control self-assessment measures the gap between the risk your organisation faces before controls are applied (inherent risk) and the risk that remains after those controls operate as intended (residual risk). That gap is the number that should drive your risk appetite conversations, your capital allocation, and your remediation priorities.
The relationship runs in one direction: inherent risk is fixed by the nature of the activity; control effectiveness determines how much of that inherent risk you actually carry. A poorly designed control reduces inherent risk only on paper. A well-designed control that nobody follows reduces it not at all. RCSA as a living, evidence-led process depends on distinguishing between these two failure modes, which is why assessing control design and operating effectiveness separately is now standard practice.
For UK regulated entities, this matters beyond good governance. The FCA's operational resilience framework and the PRA's Pillar 2 requirements both expect firms to demonstrate that they understand their material operational risks and have adequate controls in place. The Basel Committee's supervisory guidance goes further, requiring granular, auditable risk views that are consistent between local entities and group reporting. An RCSA programme that produces a credible, evidence-backed residual risk profile is the most direct way to satisfy those expectations.
A well-run RCSA produces a short set of concrete outputs:
- A risk register with inherent scores, control ratings, and residual scores for each identified risk
- An action plan with named owners, deadlines, and evidence requirements
- A KRI dashboard linking quantitative early-warning indicators to each material risk
- A reporting pack suitable for the risk committee and board, showing trend, velocity, and escalation status
The six core steps of the RCSA lifecycle
The RCSA lifecycle is not a single event. It is a closed loop that runs continuously, with calendar-based reviews supplemented by trigger-based updates whenever a KRI breaches its threshold, a significant operational change occurs, or an internal or external loss event lands. Leading practice is shifting from annual attestations to continuous, data-led monitoring by integrating losses, audit findings, control testing, and KRIs into the assessment cycle.
-
Scope and plan. Define the business unit, process, or risk domain in scope. Confirm objectives, agree the risk taxonomy, and assemble pre-work data (loss events, prior audit findings, existing control inventories). Decisions here determine the granularity of everything downstream.
-
Identify risks. Facilitate a structured identification exercise against the agreed taxonomy. Inputs include process maps, incident logs, regulatory guidance, and subject-matter expertise. Output: a longlist of candidate risks mapped to business objectives.
-
Assess inherent risk. Score each risk on a likelihood × impact scale before any controls are considered. This isolates the underlying exposure and prevents the common error of conflating a well-controlled risk with a low-inherent-risk one.
-
Evaluate control design and operating effectiveness. For each risk, list the controls in place, assess whether their design is adequate to address the risk, and separately assess whether they are operating as designed. A control can be well-designed but poorly executed, or vice versa. Assessing these two dimensions separately is the step most organisations skip, and it is where the most useful findings emerge.
-
Determine residual risk. Apply the control effectiveness rating to the inherent score to arrive at residual risk. Where residual risk exceeds appetite, an action is mandatory. Where it sits within appetite but close to the boundary, a KRI trigger should be set.
-
Report and remediate. Produce the risk register, action plan, and reporting pack. Assign owners. Set review dates. Feed findings back into the KRI dashboard and schedule the next assessment trigger. Second-line challenge should review scoring consistency before outputs are finalised; third-line audit should periodically validate the process itself.
How to run an RCSA workshop that produces usable outputs
The workshop is where the RCSA process either earns its credibility or loses it. A poorly facilitated session produces consensus scores that reflect the most senior person in the room, not the actual risk profile. A well-run one produces a draft risk register that survives second-line scrutiny.
Pre-work (one to two weeks before)
- Confirm scope and distribute the risk taxonomy and any prior assessment outputs
- Collect loss data, incident logs, audit findings, and KRI trend data relevant to the scope
- Select participants: process owners, control operators, a second-line representative, and relevant subject-matter experts. Involving staff with direct operational expertise prevents superficial assessments
- Distribute a pre-read pack with the scoring matrix, definitions, and a blank template row
- Brief the facilitator on known sensitivities and any risks flagged by second line in advance
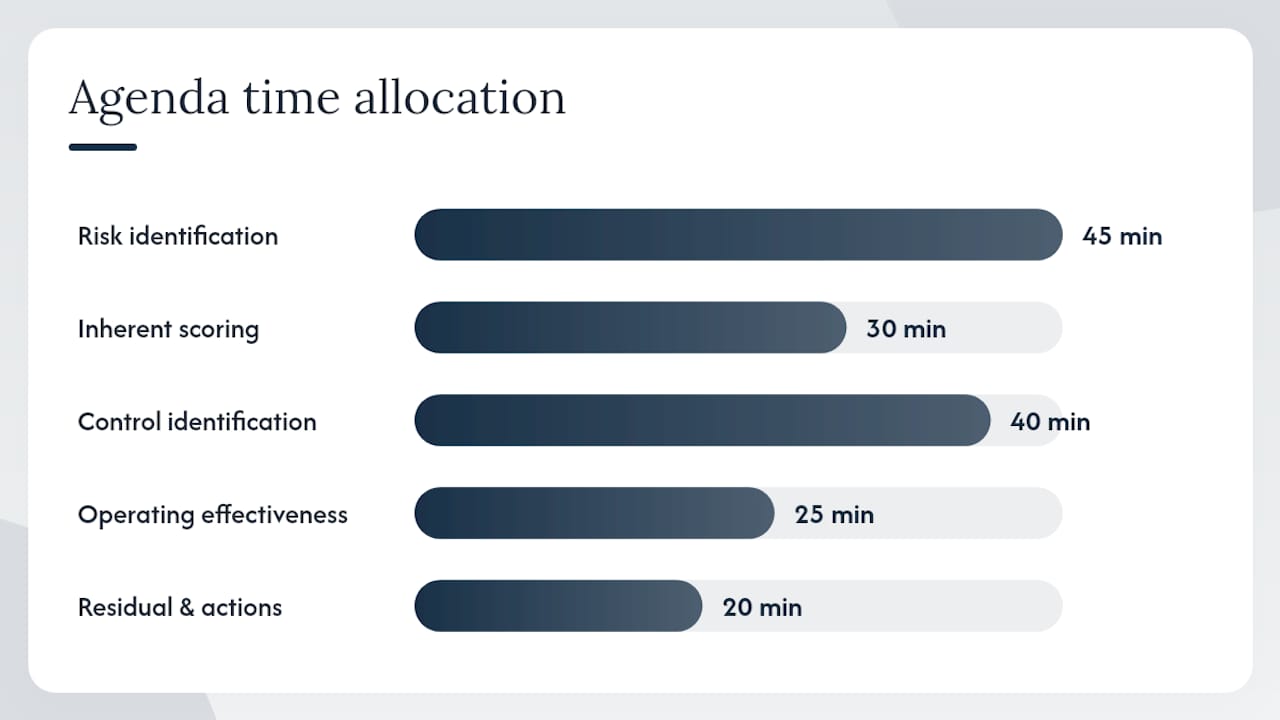
Sample agenda: 3-hour focused session
- Welcome and objectives (10 minutes): scope, ground rules, scoring scale walkthrough
- Risk identification (45 minutes): structured brainstorm against taxonomy; facilitator captures on shared screen
- Inherent risk scoring (30 minutes): likelihood and impact scored per risk; facilitator drives consensus, documents dissent
- Control identification and design assessment (40 minutes): list controls per risk; rate design adequacy
- Operating effectiveness assessment (25 minutes): evidence-based rating; note gaps immediately
- Residual risk and action prioritisation (20 minutes): calculate residual scores; agree owners and deadlines for red-rated items
- Wrap-up and next steps (10 minutes): confirm post-workshop actions, evidence requests, and review date
For a full-day session covering a complex process or multiple risk domains, extend steps 2 through 5 proportionally and add a 30-minute break between inherent scoring and control assessment to let participants reflect.
Facilitator checklist
- Prevent the most senior attendee from anchoring scores before others have spoken
- Capture dissenting views in the notes column, not just the consensus score
- Flag any risk where evidence is absent and mark it for post-workshop follow-up
- Avoid closing a risk row without an agreed owner for any required action
- Document the evidence cited for each control effectiveness rating
Post-workshop deliverables: draft risk register with all scores populated, evidence log listing what was cited and what is outstanding, action plan with owners and deadlines, and a summary note for second-line review.
Pro Tip: Set a 48-hour rule: all evidence gaps identified in the workshop must be assigned to a named owner within two working days. Gaps that drift beyond a week rarely get resolved before the next scheduled review.
How to score risks and controls: matrices, residual risk and KRIs
Scoring is where subjectivity enters the RCSA process and where most programmes quietly fail. The antidote is calibration: defined descriptors for each point on your scale, not just numbers.
The 5×5 likelihood and impact matrix
A standard 5×5 matrix scores likelihood from 1 (rare: less than once in five years) to 5 (almost certain: more than once per year), and impact from 1 (negligible: no material financial, regulatory, or reputational consequence) to 5 (critical: material regulatory sanction, significant financial loss, or major operational disruption). Inherent risk = likelihood score × impact score, giving a range of 1–25.
| Score | Likelihood descriptor | Impact descriptor |
|---|---|---|
| 1 | Rare (< once in 5 years) | Negligible |
| 2 | Unlikely (once in 2–5 years) | Minor |
| 3 | Possible (once per year) | Moderate |
| 4 | Likely (several times per year) | Significant |
| 5 | Almost certain (monthly or more) | Critical |
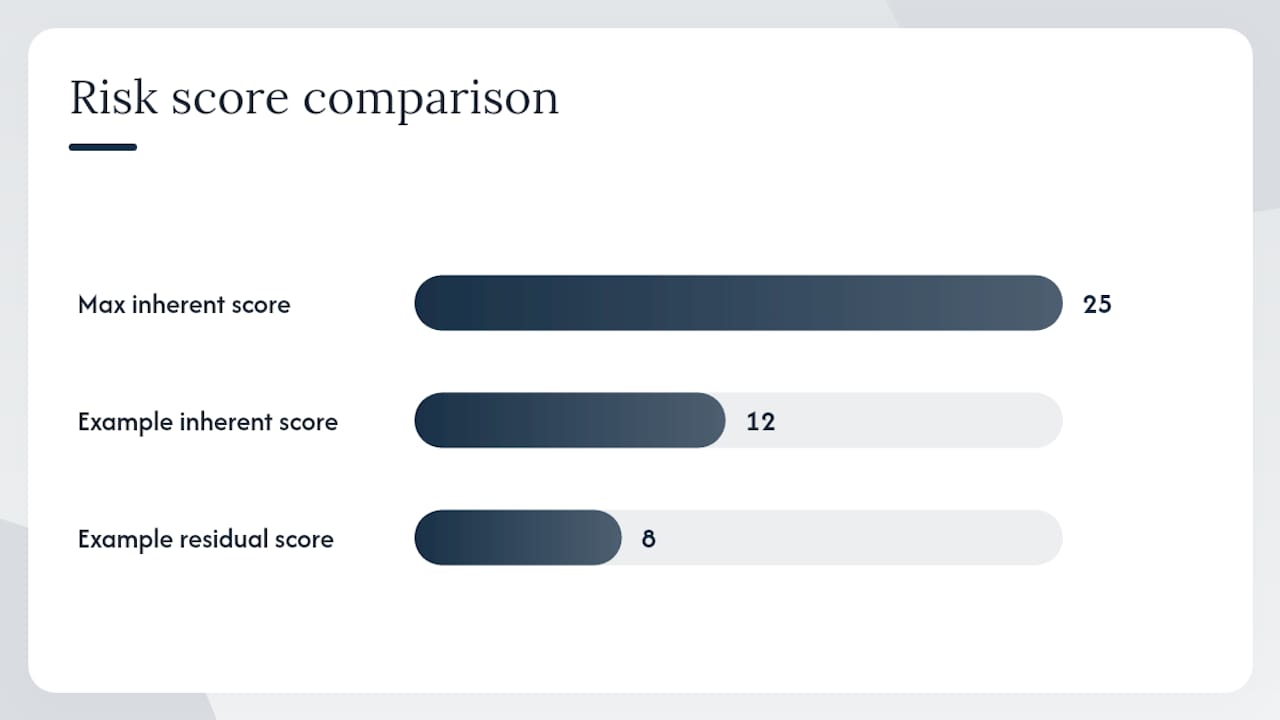
Worked example: A payment processing team assesses the risk of duplicate payment due to a manual reconciliation gap. Likelihood: 4 (occurs several times per year based on incident log). Impact: 3 (moderate financial loss, recoverable). Inherent score: 12.
Controls in place: automated duplicate-detection flag (design: adequate, rating 4/5) and a daily manual reconciliation check (design: adequate, operating effectiveness: 2/5 — evidence shows the check is performed only three days per week). Combined control effectiveness: moderate. Residual risk score: 8 (amber).
Converting scores to RAG and linking KRIs
Map residual scores to RAG: 1–6 green, 7–14 amber, 15–25 red. Red risks require an immediate action plan. Amber risks require a KRI trigger.
Effective KRIs have three elements: a quantifiable metric, defined thresholds (green/amber/red), and a pre-assigned response protocol. Most organisations should track 15–25 KRIs with 2–3 per top risk. For the duplicate payment example, a suitable KRI is: percentage of daily reconciliation checks completed on time (green: ≥95%, amber: 80–94%, red: <80%). A breach of the amber threshold triggers an out-of-cycle RCSA update for that control, not a full programme reset.
A weighted scoring model can add further precision where some risk categories carry greater regulatory or financial weight than others.
Turning RCSA findings into governance outputs
An RCSA that produces a spreadsheet nobody reads has failed, regardless of how well the workshop ran. The outputs need to be structured for governance use from the moment they are drafted.
Risk register fields
| Field | Purpose | Evidence type |
|---|---|---|
| Risk ID | Unique reference for tracking and cross-referencing | System-generated or sequential |
| Objective | Business objective the risk threatens | Process map, strategy document |
| Risk description | Clear, cause-and-consequence statement | Workshop output |
| Inherent score | Likelihood × impact before controls | Scored in workshop, calibrated against loss data |
| Controls | Named controls with design rating | Control inventory, policy documents |
| Control effectiveness | Operating effectiveness rating with evidence | Test results, logs, audit findings |
| Residual score | Post-control risk level | Calculated from above |
| Risk owner | Named individual accountable for residual risk | Agreed in workshop |
| Actions | Remediation steps with deadlines | Action plan |
| Evidence log | Documents cited to support ratings | Attached or linked in GRC system |
Remediation plan essentials
Each action arising from a red or amber residual risk needs: a named owner, a target completion date, a description of the evidence that will demonstrate closure, and a defined escalation path if the deadline is missed. Actions without these four elements rarely close.
Reporting for risk committees and boards
A reporting pack for the risk committee should include:
- A summary heat map showing residual risk distribution across the assessed scope
- A trend view: how scores have moved since the prior assessment
- A list of red-rated risks with action status and owner
- KRI dashboard showing current status against thresholds
- Actions overdue or at risk of missing their deadline
- Any risks where second-line challenge resulted in a score change
Supervisory bodies increasingly expect granular, auditable risk views that are consistent between local entities and group reporting. A well-structured risk register and reporting pack is the most direct way to demonstrate that consistency to an examiner.
A project portfolio dashboard approach, applied to RCSA outputs, can give senior stakeholders a single-screen view of risk status across multiple business units.
How often to run RCSAs and what to budget
Frequency is not a fixed answer. It is a function of risk profile, regulatory expectation, and the maturity of your monitoring infrastructure.
Dynamic frequency model
- Annual full review: covers all material risks and processes; suitable as a baseline for most UK regulated entities
- Biannual targeted review: for high-risk processes or those subject to significant regulatory scrutiny; some guidance recommends at least biannual reviews for key areas depending on transaction volume and scale
- Trigger-based updates: activated by a KRI breach, a material operational change, a significant loss event, or an internal or external audit finding that affects a rated control
- Continuous monitoring: automated ingestion of KRI data, incident logs, and control test results to update residual risk scores between formal reviews
Resourcing estimates for a 90-day pilot
- Weeks 1–2: scope definition, taxonomy agreement, template build, facilitator briefing (8–12 hours, risk team)
- Weeks 3–4: pilot workshop for one business unit (3–6 hours facilitation, 2–3 hours participant time)
- Weeks 5–6: scoring review, second-line challenge, action plan drafting (4–6 hours)
- Weeks 7–10: evidence collection, control testing for top five risks (variable; allow 2–4 hours per control)
- Weeks 11–12: reporting pack, lessons learned, programme design for full rollout (6–8 hours)
Programme health metrics to track:
- Coverage rate: percentage of material risks with a current, evidenced assessment
- Evidence sufficiency: percentage of control ratings supported by documented evidence
- Action closure rate: percentage of remediation actions closed by their target date
- KRI breach response time: average time from KRI breach to RCSA update
Common RCSA pitfalls and how to avoid them
Most RCSA programmes fail in one of four ways, and the failure mode is usually visible within the first workshop.
The four main pitfalls
- Box-ticking: scores are agreed quickly to satisfy a compliance deadline, with no evidence and no genuine challenge. The risk register looks complete but reflects consensus opinion, not operational reality.
- Inconsistent taxonomy: different business units use different risk categories, making aggregation impossible and board reporting meaningless.
- Absent evidence: control effectiveness ratings are based on assertion rather than test results, logs, or audit findings. These ratings will not survive regulatory scrutiny.
- Wrong granularity: either too many risks (a 200-row register nobody maintains) or too few (five generic risks that hide material exposures). Aim for 15–40 risks per business unit for most regulated organisations.
Avoidance checklist
- Agree a single risk taxonomy before the first workshop and enforce it across all business units
- Require at least one piece of documentary evidence for every control effectiveness rating above "partial"
- Build second-line challenge into the process as a scheduled step, not an optional review
- Set a maximum register size per business unit and force prioritisation if it is exceeded
- Track action closure rates and escalate overdue items to the risk committee monthly
- Treat a KRI breach as a mandatory trigger for an out-of-cycle assessment update, not a note in the minutes
Pro Tip: The fastest way to rescue a box-ticking RCSA is to pick the three highest-residual-risk items from the last assessment and ask the control owner to produce the evidence that justified the rating. If they cannot, you have your starting point for a programme reset.
Moving from annual attestation to continuous, data-led RCSA
The shift from a periodic RCSA to a continuous monitoring approach is not primarily a technology decision. It is a data architecture decision: which feeds can you automate, and which still require human judgement?
Integrating losses, audit findings, control testing, and KRIs into the assessment lifecycle reduces subjectivity and improves accuracy, but manual overrides remain necessary for judgement calls that data alone cannot resolve. The practical goal is to automate the routine and reserve human effort for the genuinely complex.
Data sources to integrate
- Loss event and near-miss data: updates inherent likelihood scores dynamically
- Internal audit findings: flags controls rated as operating effectively that audit has found deficient
- Control test results: provides objective evidence for operating effectiveness ratings
- KRI feeds: triggers out-of-cycle updates when thresholds are breached
- Regulatory and external event data: prompts taxonomy reviews when new risk types emerge
Implementation checklist for phased tooling adoption
- Pilot phase (months 1–3): digitise the risk register and action plan in a structured platform; replace spreadsheets with a consistent template; establish baseline scores
- Data integration phase (months 4–6): connect loss data and incident logs to the platform; automate KRI threshold alerts; link audit findings to control records
- Automation phase (months 7–9): configure automated score updates when KRI thresholds are breached; set up scheduled review reminders; generate reporting packs automatically
- Governance embedding phase (months 10–12): integrate RCSA outputs into board and risk committee reporting cycles; align with enterprise risk management and strategic planning
AI risk tools for UK regulated utilities are increasingly capable of surfacing patterns across loss data and control test results that a manual review would miss, making the case for tooling investment easier to justify to senior stakeholders.
Intelligentassessments maps directly to this phased approach. Its structured assessment frameworks replace ad hoc spreadsheets from day one. Evidence management links documentary proof to each control rating. Weighted RAG scoring and roll-ups give second-line teams an aggregated view across business units. Automated AI executive summaries reduce the time from workshop to board-ready report. For regulated UK utilities and infrastructure organisations, that combination addresses the most common bottlenecks in scaling an RCSA programme.
A copyable RCSA template for your risk register and workshop checklist
The table below gives a single risk register row you can paste directly into a spreadsheet or GRC platform. Calibrate the descriptors to your own scoring scale before use.
| Field | Sample entry | Notes |
|---|---|---|
| Risk ID | OPS | Sequential within business unit |
| Objective | Accurate and timely payment processing | Linked to process map reference |
| Risk description | Duplicate payments issued due to manual reconciliation gap | Cause: manual process; consequence: financial loss, reputational impact |
| Inherent likelihood | 4 — Likely | Based on incident log: 6 occurrences in prior 12 months |
| Inherent impact | 3 — Moderate | Average loss per event: recoverable within reporting period |
| Inherent score | 12 (amber) | 4 × 3 |
| Control 1 | Automated duplicate-detection flag | Design: adequate (4/5); Operating effectiveness: strong (5/5) |
| Control 2 | Daily manual reconciliation check | Design: adequate (4/5); Operating effectiveness: partial (2/5) — performed 3 days/week |
| Blended control effectiveness | Moderate | Weighted average of two controls |
| Residual score | 8 (amber) | Requires KRI trigger and monitoring |
| Risk owner | Head of Finance Operations | Named individual, not a team |
| KRI | % of daily reconciliation checks completed on time | Green ≥95%, amber 80–94%, red <80% |
| Action | Automate daily reconciliation check | Owner: IT; deadline: —; evidence: system log showing automated runs |
| Evidence cited | Incident log Q3–Q4, system configuration document | Attached to register row |
Workshop checklist (8–10 items for a closed-loop session)
- Scope and objectives confirmed and distributed to all participants in advance
- Risk taxonomy agreed and shared as a reference document
- Pre-read pack (scoring matrix, blank template, prior assessment) sent at least five working days before
- Participants confirmed: process owner, control operators, second-line representative, relevant SMEs
- Facilitator briefed on known sensitivities and prior audit findings
- Evidence log template prepared for real-time capture during the session
- Scoring consensus rules agreed (e.g., facilitator calls a vote if no consensus after two rounds)
- Post-workshop evidence gap list assigned to named owners within 48 hours
- Draft register circulated to second line within five working days of the workshop
- Action plan with owners and deadlines signed off before the session closes
A risk control matrix provides a complementary structure for mapping controls to risks in more detail, particularly where a single risk has multiple layered controls.
Key takeaways
An effective RCSA process treats risk assessment as a living, evidence-led cycle rather than an annual compliance exercise, and residual risk scores should drive both remediation priorities and board reporting.
| Point | Details |
|---|---|
| Separate inherent from residual risk | Score likelihood × impact before controls, then adjust for control effectiveness to get a meaningful residual figure. |
| Assess controls on two dimensions | Rate design adequacy and operating effectiveness separately; a well-designed control that is not followed reduces residual risk only on paper. |
| Use KRIs to trigger updates | Track 15–25 KRIs with defined thresholds; a breach should trigger an out-of-cycle RCSA update, not just a note in the minutes. |
| Run a 90-day pilot first | Scope one business unit, run a workshop, score end-to-end, and use the output to calibrate your scales before enterprise rollout. |
| Intelligentassessments for continuous RCSA | Intelligentassessments replaces spreadsheets with structured frameworks, evidence management, weighted RAG roll-ups, and automated reporting for UK regulated organisations. |
Why most RCSA programmes underdeliver and what actually fixes them
The gap between what an RCSA promises and what it delivers in practice usually comes down to one thing: the process is designed to satisfy a compliance requirement rather than to produce a decision. When the primary audience for the output is the regulator rather than the risk owner, the incentive structure is wrong from the start. Scores drift towards amber because red requires an action plan and green invites scrutiny. Evidence is cited rather than tested. The register grows longer each year because nobody has the authority to retire a risk that has been adequately controlled for three consecutive cycles.
The fix is not a better template. It is a clearer governance mandate: the RCSA output should be the primary input to the risk committee's agenda, not a supporting annex. When senior leaders actually use the residual risk scores to make investment and prioritisation decisions, the quality of the underlying assessments improves almost automatically. Participants stop gaming the scores when they know the scores have consequences.
The second thing most programmes get wrong is treating the annual workshop as the RCSA. The workshop is one input. The KRI dashboard, the incident log, the control test results, and the audit findings are the others. A programme that integrates all of these and updates scores dynamically when thresholds are breached is doing something qualitatively different from one that runs a workshop once a year and files the output. The former is a risk management tool. The latter is a compliance artefact.
How Intelligentassessments supports a continuous RCSA programme
Spreadsheet-based RCSAs have a ceiling. Once you are managing more than two or three business units, evidence gaps multiply, scoring inconsistencies compound, and producing a board-ready report becomes a manual effort that consumes more time than the assessment itself.
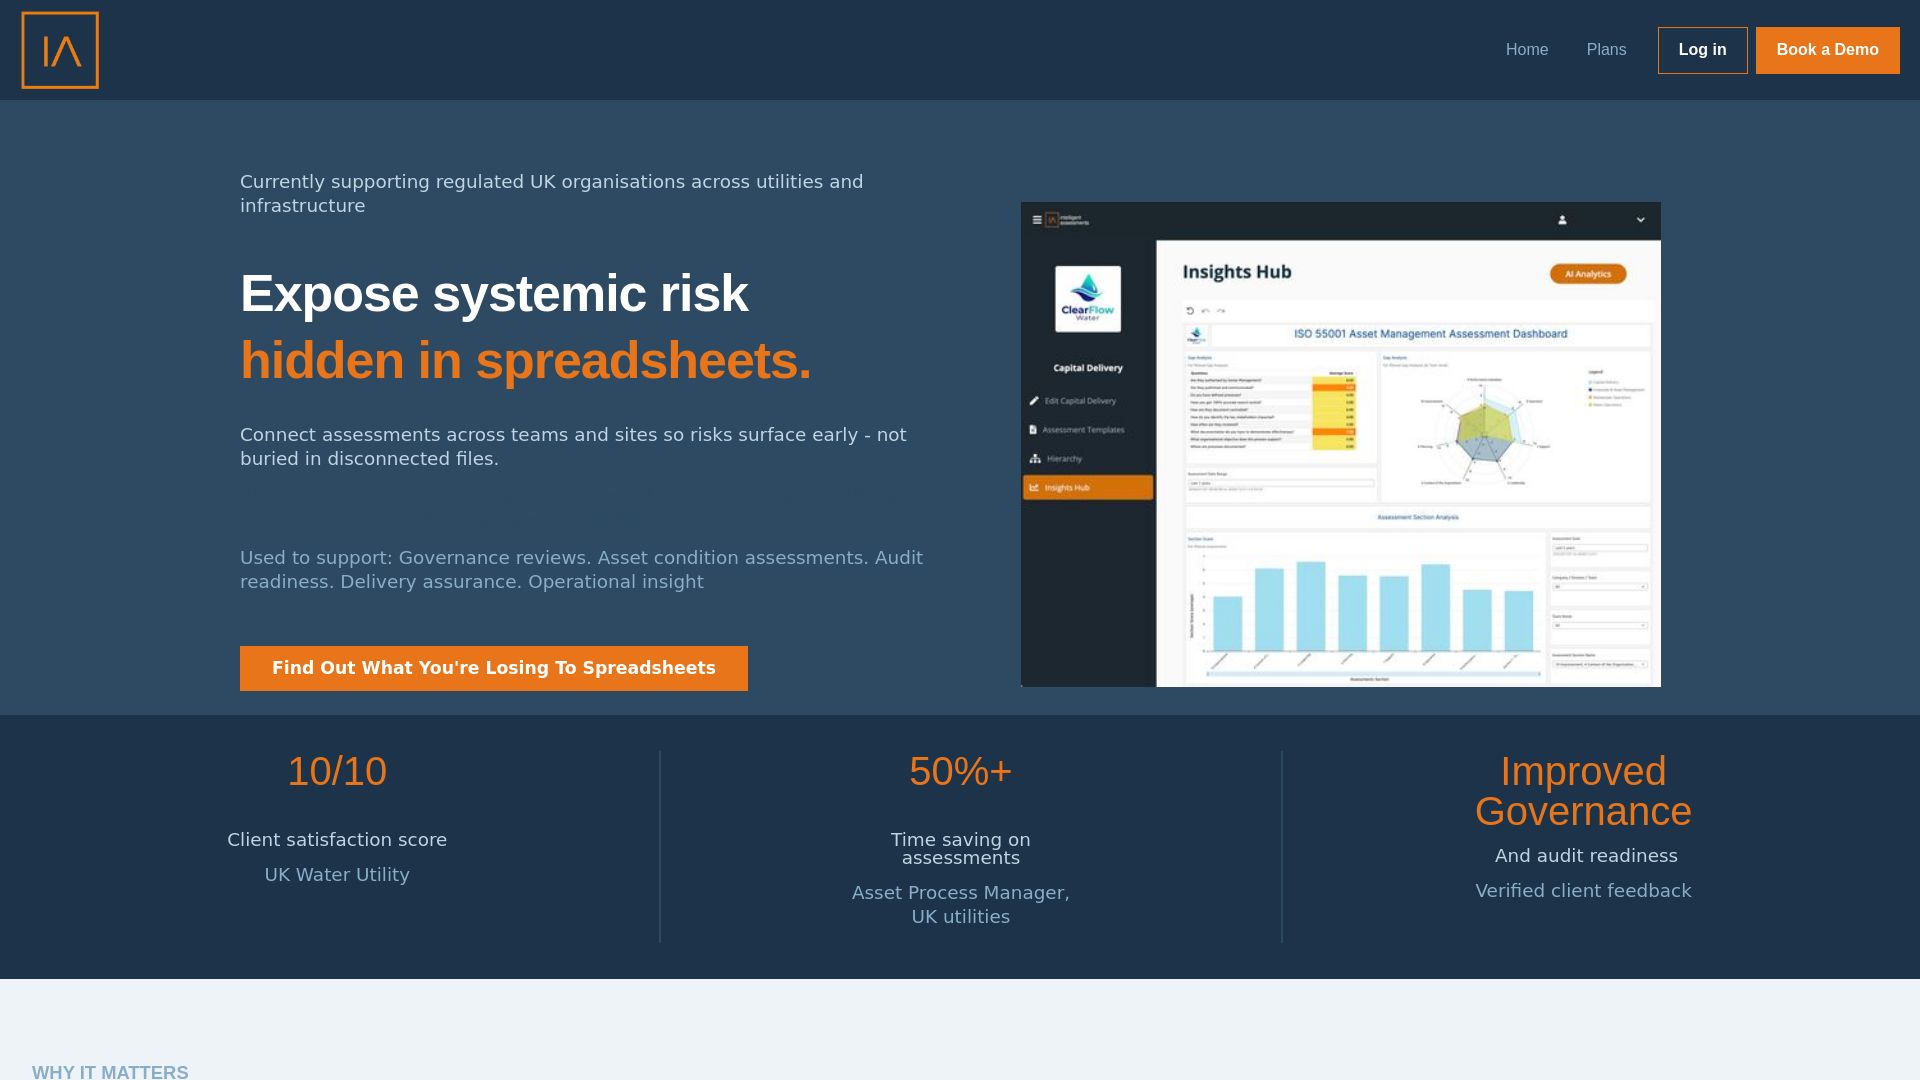
Intelligentassessments replaces that overhead with a structured platform built for exactly this workflow. Structured assessment frameworks enforce a consistent taxonomy across every business unit. Evidence management links documentary proof directly to each control rating, so second-line challenge and regulatory review have an auditable trail from day one. Weighted RAG scoring and roll-ups aggregate residual risk scores across the programme automatically, giving risk leaders a live view of where the organisation sits against appetite. Automated AI executive summaries turn completed assessments into board-ready reporting packs without a manual drafting step.
For UK regulated utilities and infrastructure organisations running RCSAs across multiple sites or functions, the platform's real-time dashboards and CSV export capability mean findings feed directly into enterprise risk reporting rather than sitting in a separate spreadsheet. Book a demo to see how the platform handles a live RCSA workflow, or review the subscription plans to understand licensing options for your organisation.
Useful sources and further reading
The sources below are the primary references for the guidance in this article. Each covers a distinct aspect of the RCSA process.
-
RCSA: The Complete Guide To Risk And Control Self-Assessment — Risk Publishing. Covers the residual risk formula, the living process philosophy, and practical implementation steps. Start here for a conceptual grounding.
-
Risk and Control Self-Assessment: The Ten Steps to RCSA Redemption — Deloitte UK. Describes the industry shift to continuous, data-led RCSA and provides ten practical improvement steps. Useful for practitioners looking to modernise an existing programme.
-
Risk and Control Self-Assessment — BDO Global. Explains RCSA outputs, workshop structure, and how the process maps to business objectives. Practical for facilitators and second-line teams.
-
The Risk and Control Self-Assessment (ISACA Journal, 2023, Volume 6) — ISACA. Provides technical guidance on scoring control design and operating effectiveness separately. Recommended for practitioners building or calibrating a scoring methodology.
-
Guide to Risk and Control Self-Assessment for Business — J.P. Morgan. Practical guidance on workshop formats, stakeholder selection, and review cadence. Useful for smaller or mid-market organisations designing their first programme.
-
Basel Committee on Banking Supervision — Principles for Operational Risk Management (d515) — Bank for International Settlements. The regulatory baseline for operational risk reporting expectations, including granularity and auditability requirements. Consult this when aligning RCSA outputs to Pillar 2 or supervisory reporting.
-
Key Risk Indicators: Examples and Best Practice — Risk Publishing. Defines KRI design, threshold frameworks, and a 90-day implementation roadmap. Use this when building or refining your KRI dashboard.